Section 10. Viewing Your Survey Results
You can view survey results at any time. Survey results take on an entirely new dimension with the intuitive and feature-rich capabilities of SurveyGold. Defined filtered views of survey results based on any responses given or date ranges or both. Drill-down for progressive detail. Display results in colorful 2D and 3D graphs. The View Results tab makes it possible to take control of how you look at your survey responses.
Tap or click images to enlarge them.
Tap or click images to enlarge them.
Selecting a Survey to View
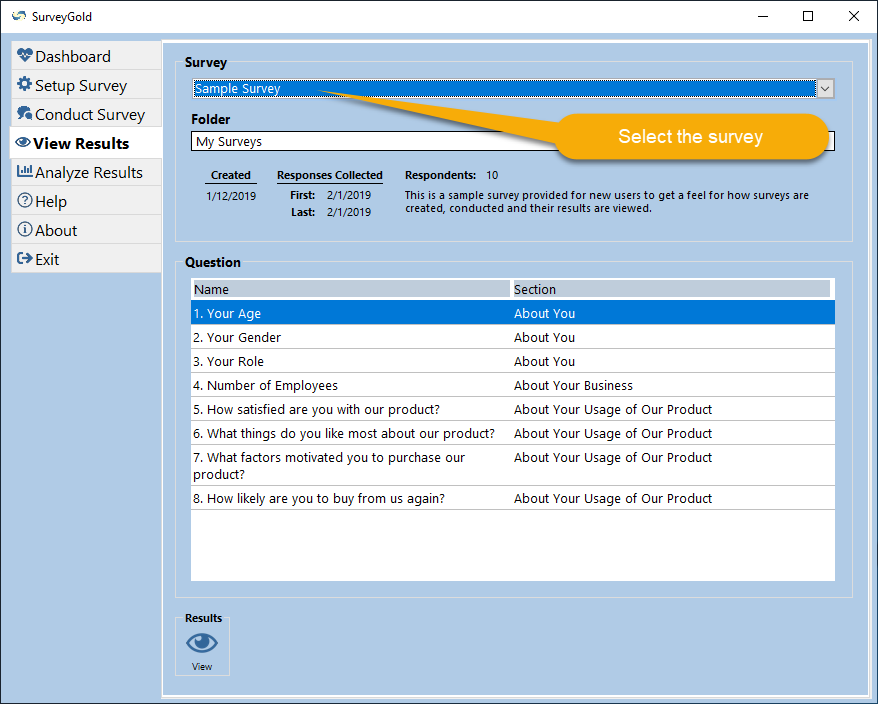
The View Results tab provides access to survey results. The initial view of the survey results is a high-level summary including the number of respondents, response date ranges and survey description the currently selected survey. From this point you can see progressively more and more detail as you select questions and view responses.
The View Results tab provides access to survey results. The initial view of the survey results is a high-level summary including the number of respondents, response date ranges and survey description the currently selected survey. From this point you can see progressively more and more detail as you select questions and view responses.
Selecting a Question to View
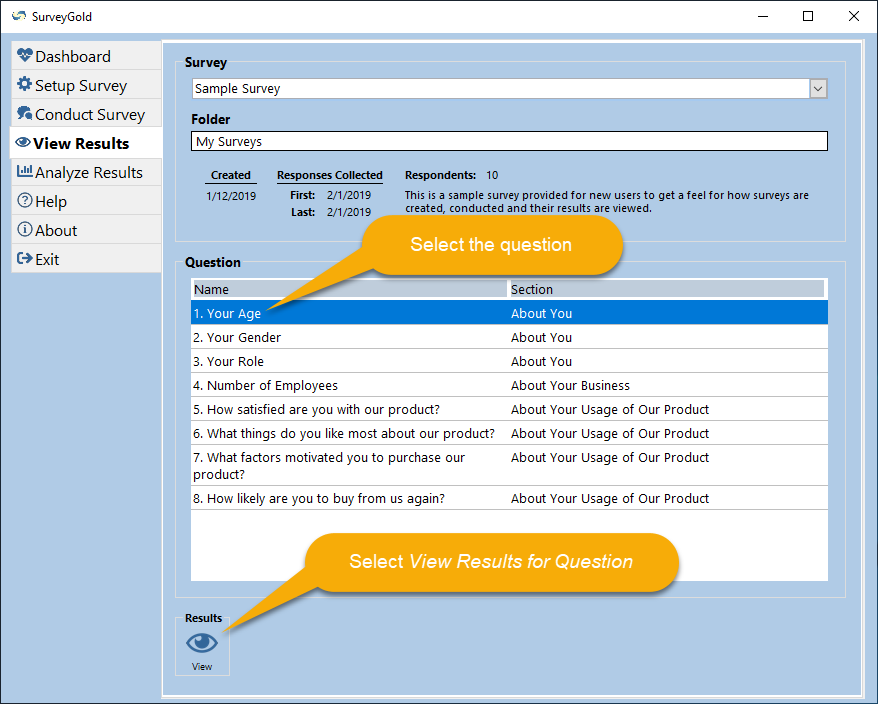
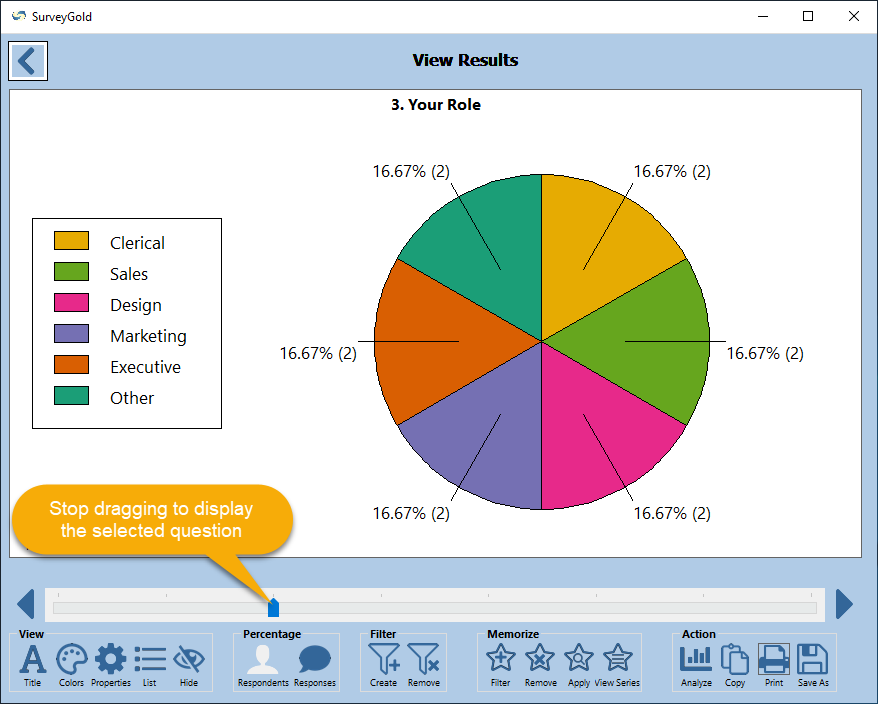
Begin viewing survey results by selecting a question in the View Results tab. You may select a question to view in one of several ways in the results viewer. The method you choose depends upon which screen is currently displayed.
Begin viewing survey results by selecting a question in the View Results tab. You may select a question to view in one of several ways in the results viewer. The method you choose depends upon which screen is currently displayed.
Navigating Through Questions While Viewing Results
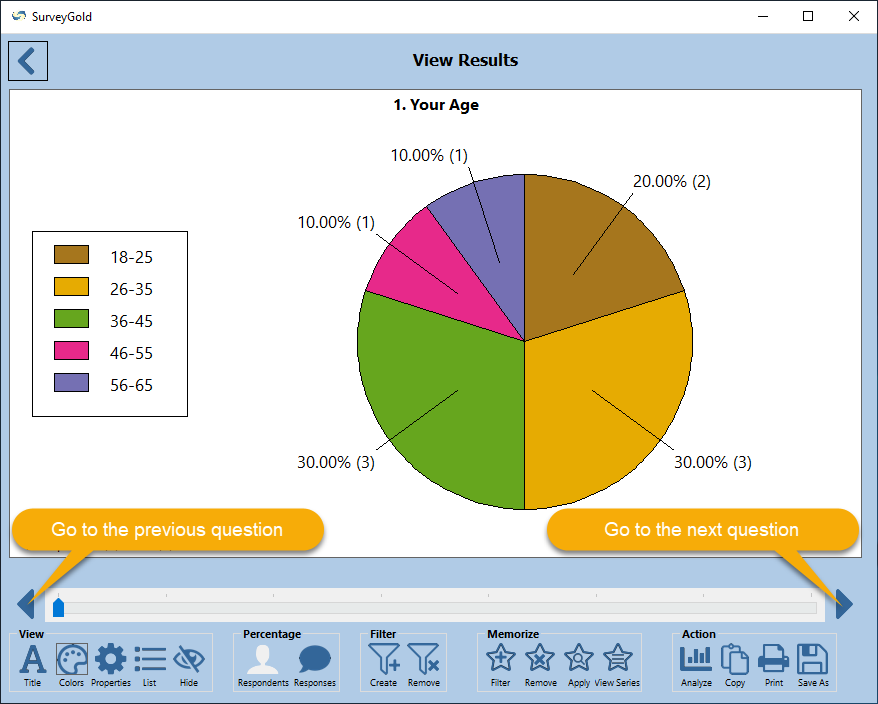
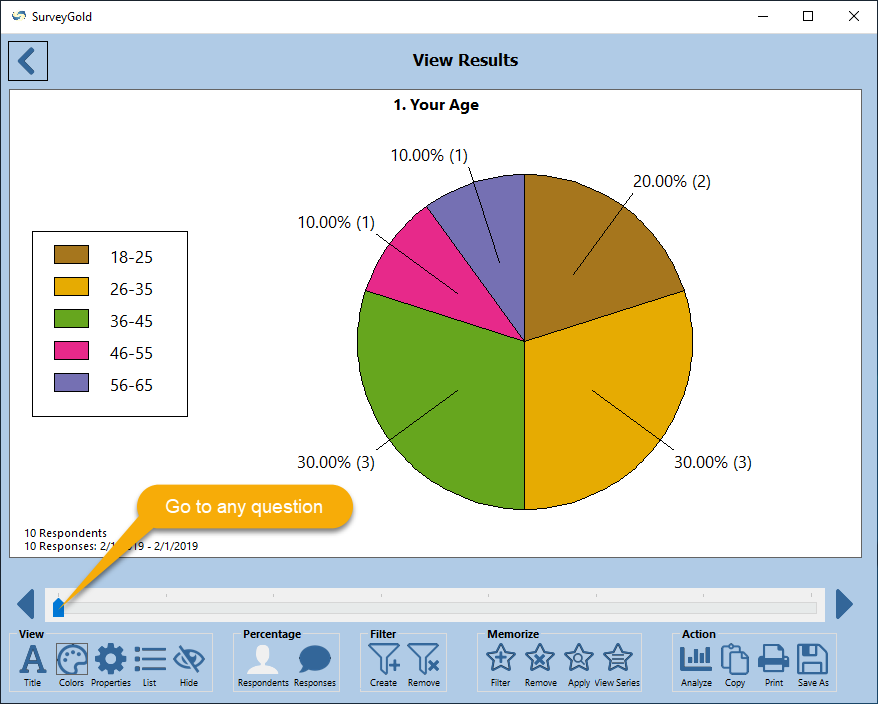
Once the responses to a question are displayed, you may select Next Question to view the responses to the next question or select Previous Question to view the responses to the previous question.
Once the responses to a question are displayed, you may select Next Question to view the responses to the next question or select Previous Question to view the responses to the previous question.
|
Step 1 - While viewing the results of a question, select the next question or previous question using the navigation buttons.
Tip: Use your keyboard to quickly navigate through questions.
|
Viewing Question Results
Survey responses results are displayed as either a graph or as a list. It depends upon whether or not the question has response choices from which the respondent selected a response.
Survey responses results are displayed as either a graph or as a list. It depends upon whether or not the question has response choices from which the respondent selected a response.
- When a Question Has Response Choices: Summary Graph or Tabular List
Questions with response choices are displayed as a chart in a graphical format or in a tabular summary list. In a graphical format, response choices provided by respondents are grouped into graph segments. Each graph segment represents the number of occurrences of a particular response choice and a percentage. In a tabular summary list, response choices provide by respondents are summarized on a separate line in the list. Each line includes the number of occurrences of a particular response choice and a percentage. - When a Question Has No Response Choices: Summary Tabular List
Questions without response choices are displayed as a chart in a tabular list of responses. Each line includes the number of occurrences of a particular response and a percentage.
Changing the Chart Title
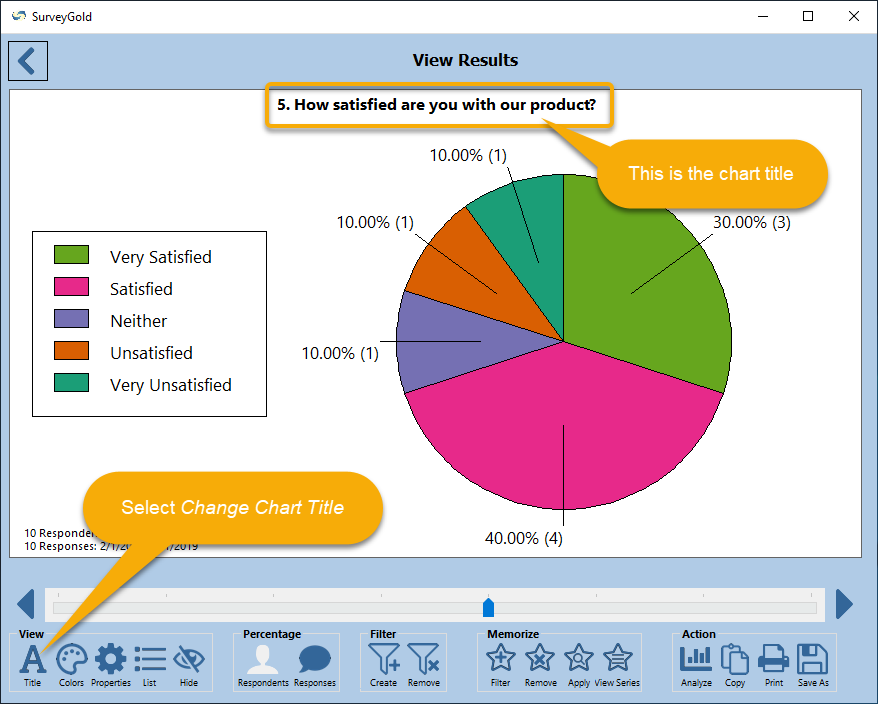
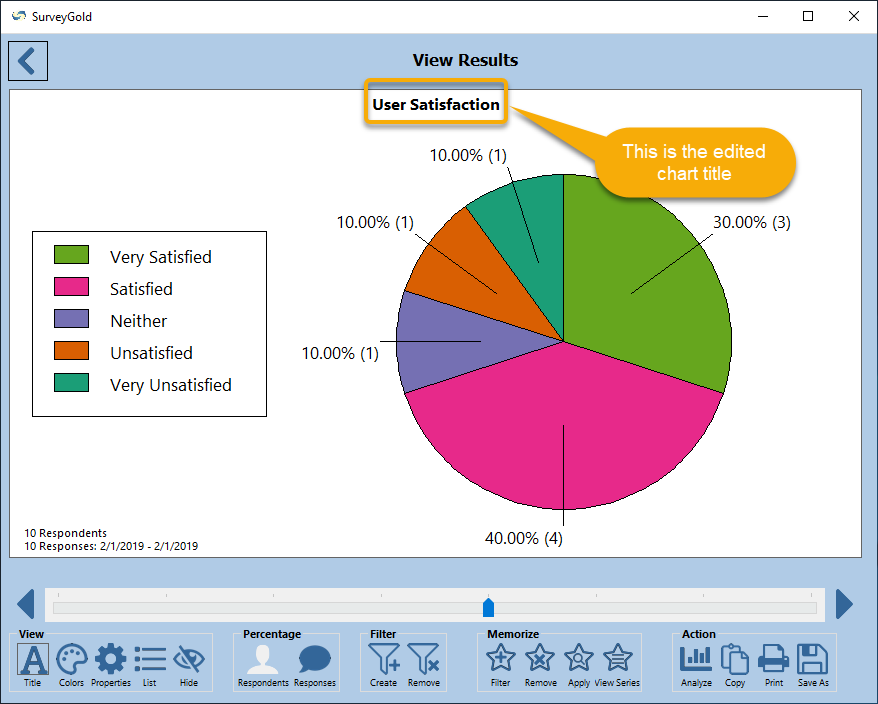
Normally the question text appears as the chart title above the graph or tabular list. Sometimes the question text is so lengthy or phrased in such a way that it does not work well as a chart title. You can change the chart title so that it is more concise or is more readable to consumers of the chart. Changing the chart title does not change the question text.
Normally the question text appears as the chart title above the graph or tabular list. Sometimes the question text is so lengthy or phrased in such a way that it does not work well as a chart title. You can change the chart title so that it is more concise or is more readable to consumers of the chart. Changing the chart title does not change the question text.
|
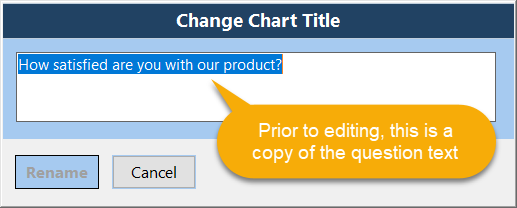
Step 2 - When the Change Chart Title window opens, the chart title appears. If this has not been edited before, the chart title is an exact copy of the question text.
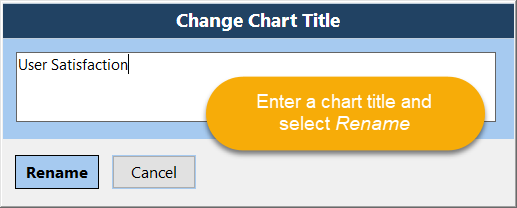
Enter a chart title and select Rename from the button bar. The window closes and the chart title is changed in the chart for the currently displayed question. |
Changing Graph Colors
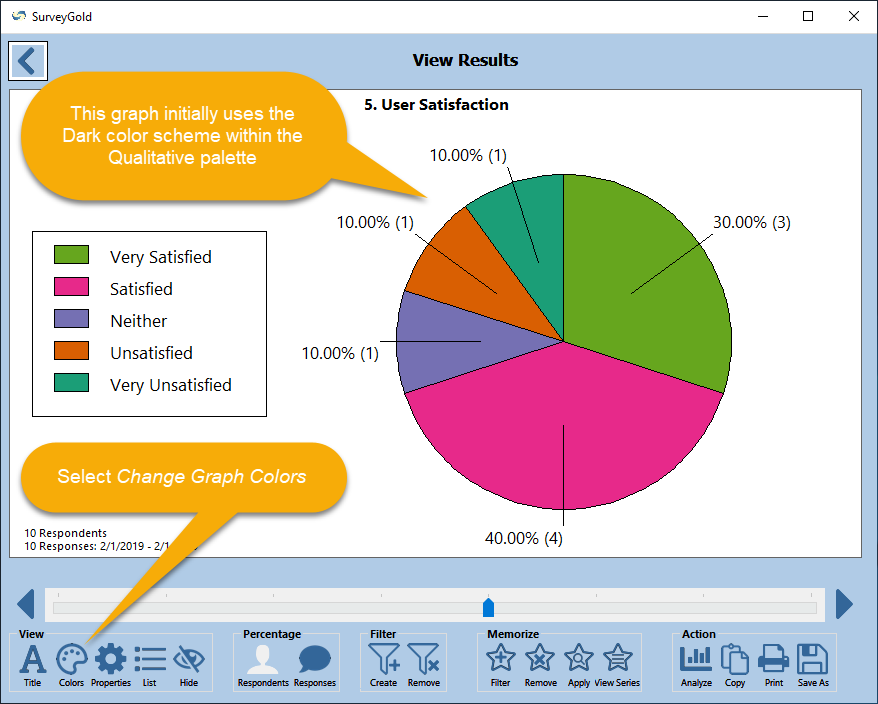
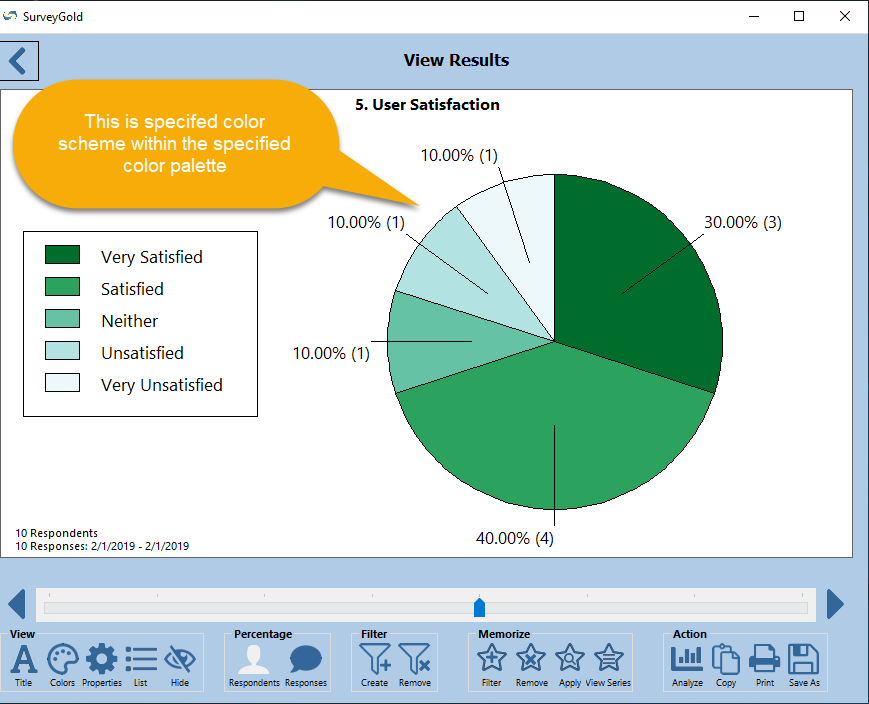
The effective use of color can make a graph easier to understand. SurveyGold provides several color palettes that represent data in a way that makes graph easier to understand. A color palette and color scheme within that palette are associated with every question that has response choices. SurveyGold makes automatic choices at first and then allows you to customize those choices for your purposes.
Color Palettes
Color Schemes
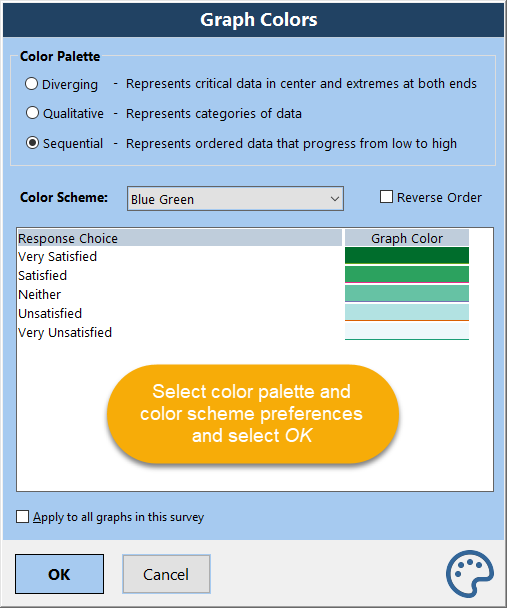
Within each pallet, a variety of schemes are available for selection. A scheme represents a defined set of colors that work together effectively. Some are lighter hued others are darker.
Each color in the color scheme represents a specific question response choice.
Note: SurveyGold automatically displays graphs using the Dark color scheme in the Qualitative palette unless specified otherwise.
Note: Some schemes have a relatively small number of colors. If the number of response choices for a question exceeds the number colors in the selected color scheme, then the color palette reverts to Sequential and a random color scheme is produced to ensure each color is distinct. In this context, it is not possible to adjust the colors in the color scheme.
The effective use of color can make a graph easier to understand. SurveyGold provides several color palettes that represent data in a way that makes graph easier to understand. A color palette and color scheme within that palette are associated with every question that has response choices. SurveyGold makes automatic choices at first and then allows you to customize those choices for your purposes.
Color Palettes
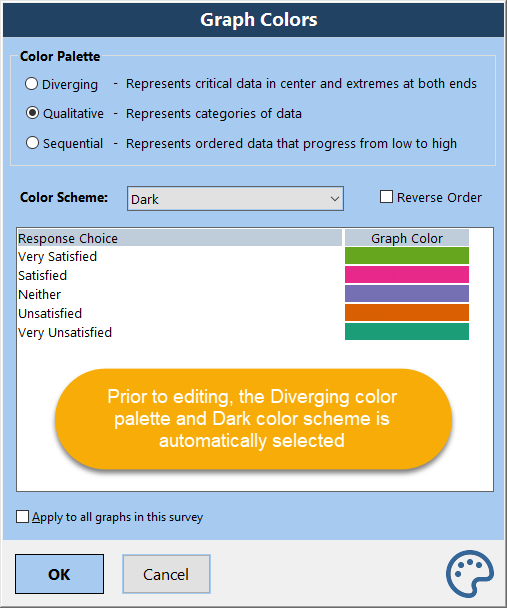
- Qualitative - Represents categories of data (commonly used for a demographic question)
Examples: age, gender, race, marital status, city, state, department, organization, occupation, annual income, education level
Note: SurveyGold automatically displays graphs using a Qualitative palette unless specified otherwise.
- Sequential - Represents ordered data that progresses from low to high or vice versa (commonly used for a rating question)
Examples: customer satisfaction, ranked preference, opinion, net promoter, monetary values (expenses, income), level of effort - Diverging - Represent critical data in center and extremes at both ends (commonly used for a numeric value question)
Examples: temperature above or below freezing, expenditures above/below budget
Color Schemes
Within each pallet, a variety of schemes are available for selection. A scheme represents a defined set of colors that work together effectively. Some are lighter hued others are darker.
Each color in the color scheme represents a specific question response choice.
Note: SurveyGold automatically displays graphs using the Dark color scheme in the Qualitative palette unless specified otherwise.
Note: Some schemes have a relatively small number of colors. If the number of response choices for a question exceeds the number colors in the selected color scheme, then the color palette reverts to Sequential and a random color scheme is produced to ensure each color is distinct. In this context, it is not possible to adjust the colors in the color scheme.
|
Step 2 - When the Graph Colors window opens, the current color palette and color scheme settings appear. If this has not been edited before, the Qualitative color palette and Dark color scheme are selected.
Select a color palette and color scheme and select OK in the button bar. The window closes and the graph color is changed to the specified color scheme. Note: Select "Reverse Order" option to flip the order of colors in the color scheme. This is particular valuable with Diverging and Qualitative color palettes. Note: Select "Apply to all graphs in this survey" to quickly apply the specified color scheme to all graphs for questions with response choices in the survey. |
Changing the Graph Type, Legend and Data Values
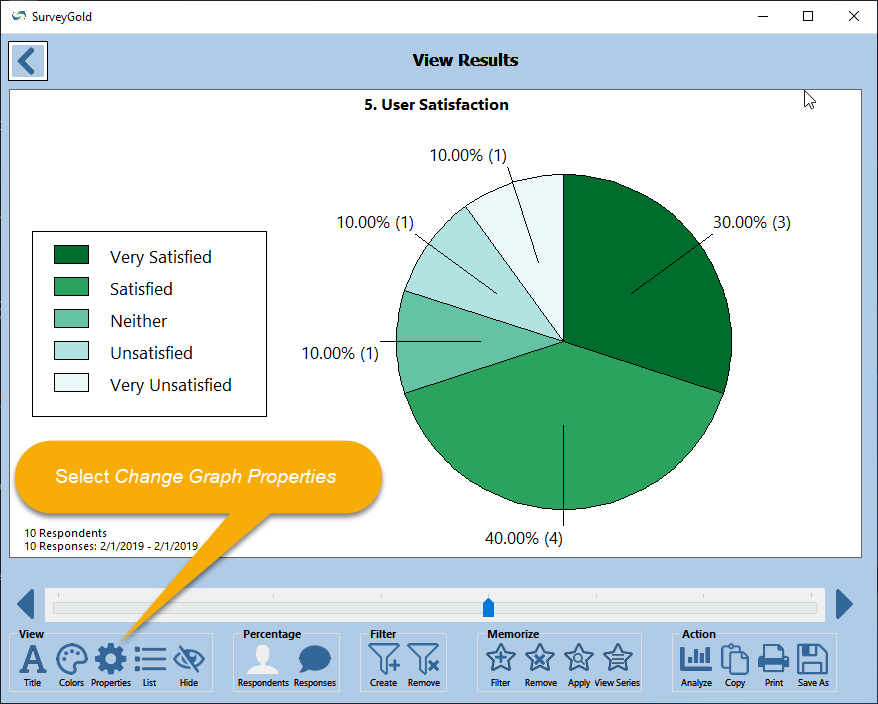
SurveyGold provides the ability for you to customize all graph properties:
SurveyGold provides the ability for you to customize all graph properties:
- Chart type - Bar, column, pie, line, area (2D or 3D for all types)
- Graph style - Font size (automatically scale or specific size)
- Legend style - Position, font size (automatically scale or specific size),
- Data values - Hide or show percentage, value, statistics, mean, mode, median and standard deviation
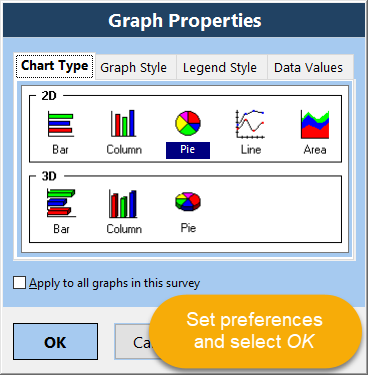
SurveyGold automatically displays results in a 2D pie chart. However, you can change the chart type to any of the following:
- Bar chart (2D or 3D)
- Column chart (2D or 3D)
- Pie chart (2D or 3D)
- Line chart (2D only)
- Area chart (2D only)
|
Step 2 - When the Graph Properties window opens, the current graph properties settings appear. If this has not been edited before, the 2D pie chart type is selected.
Select chart preference and select OK in the button bar. The window closes and the graph preferences are changed as specified. Note: Select "Reverse Order" option to flip the order of colors in the color scheme. This is particular valuable with Diverging and Qualitative color palettes. Note: Select "Apply to all graphs in this survey" to quickly apply the specified color scheme to all graphs in the survey. |
Additional Actions
Perform additional actions using the button bar (or right-clicking on the chart to display a popup menu) as follows:
Perform additional actions using the button bar (or right-clicking on the chart to display a popup menu) as follows:
- Display Graph/Tabular List - Allows you to change the chart style to either a graph or a tabular list
- Set Percentage Denominator to the Number of Respondents for Question - Uses the number of respondents as the denominator for percentage calculations
- Set Percentage Denominator to the Number of Responses for Question - Uses the number of responses as the denominator for percentage calculations
- Copy to Clipboard - Copy the chart into the Windows clipboard so that it can be pasted into another application
- Print - Allows you to print the section graph
- Save As - Save the data from the currently displayed chart into a variety of data formats
Drilling Down to View a List of Respondents
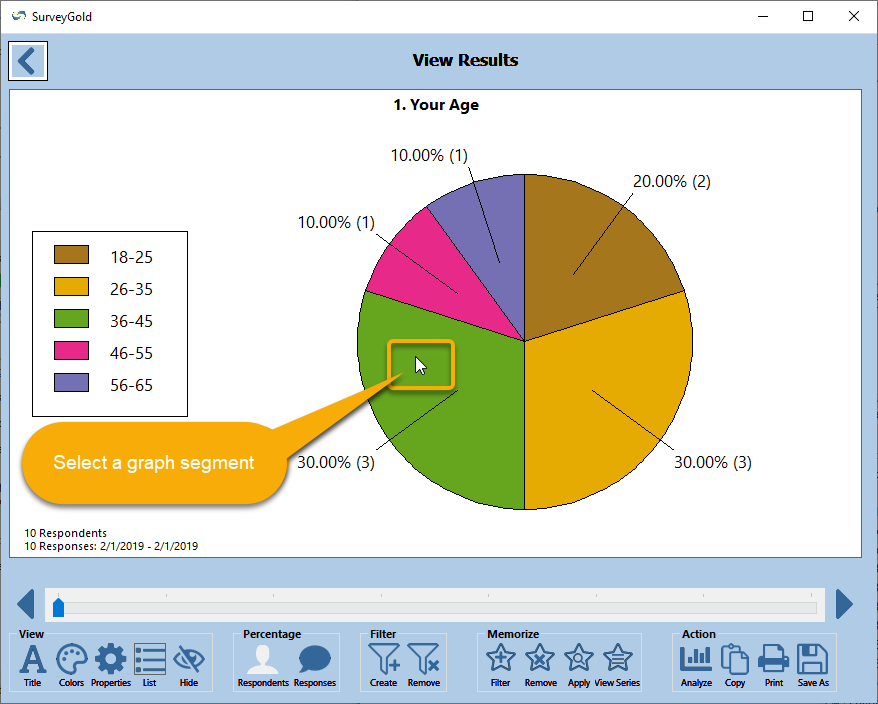
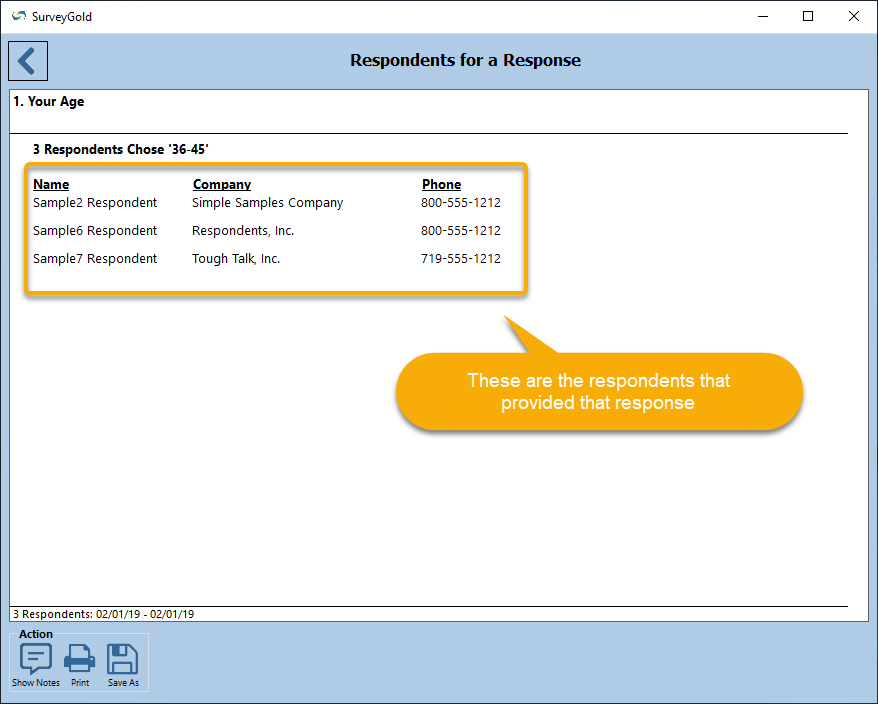
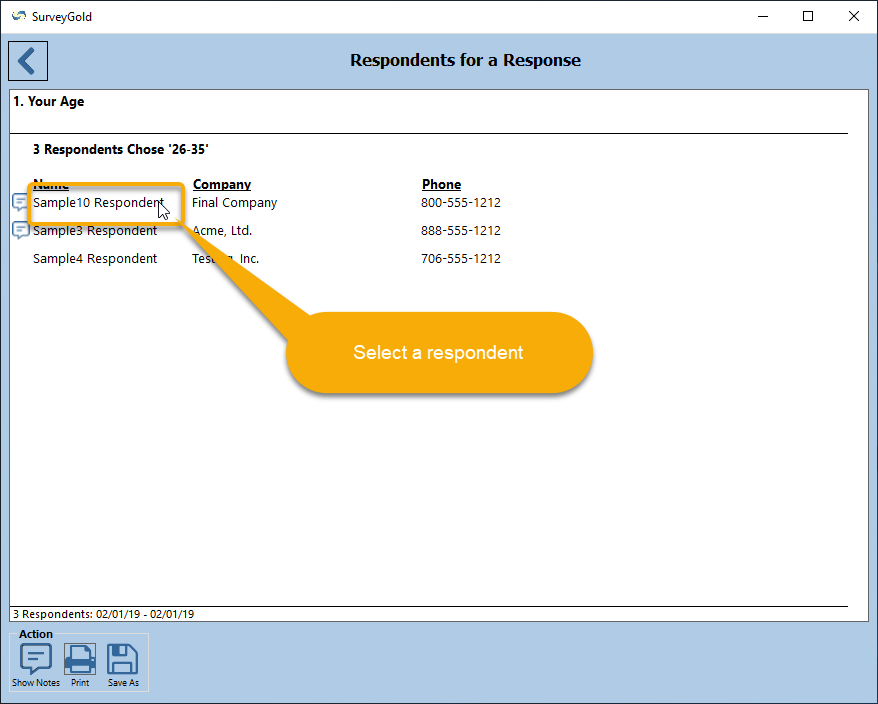
While graphs and lists provide a nice high-level view of responses, SurveyGold provides the ability to drill down to reveal more detail by simply selecting a response in a list or a graph segment.
While graphs and lists provide a nice high-level view of responses, SurveyGold provides the ability to drill down to reveal more detail by simply selecting a response in a list or a graph segment.
|
Step 1 - To view a list of respondents who provided a particular response, select a graph segment (e.g., pie slice, bar, etc.), a legend item or an item in the list. This displays a list of respondents who provided that response.
To return to the response summary level, select Return to Previous Panel. |
Viewing Response Comments
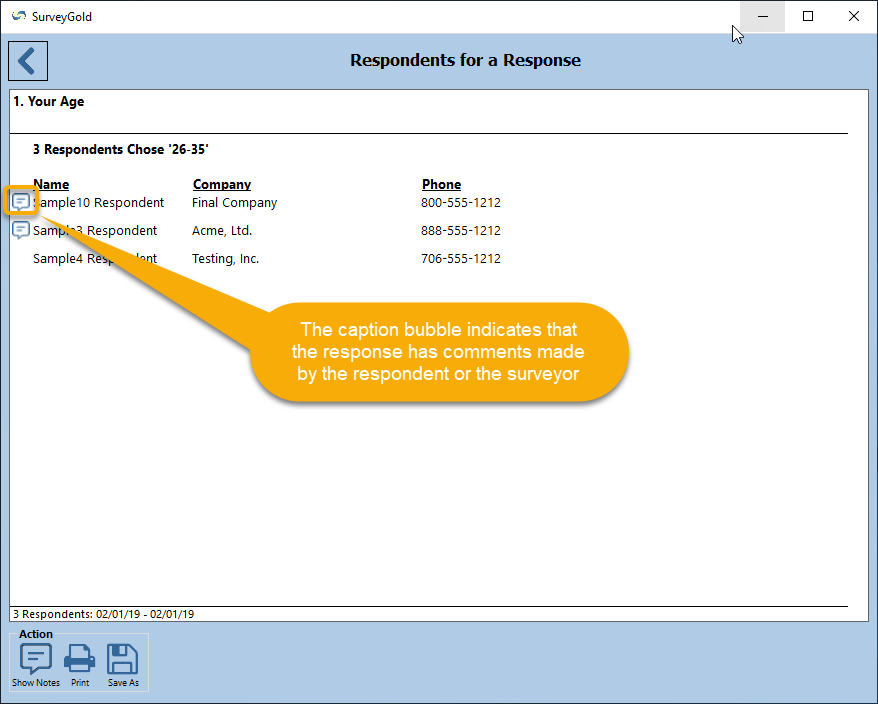
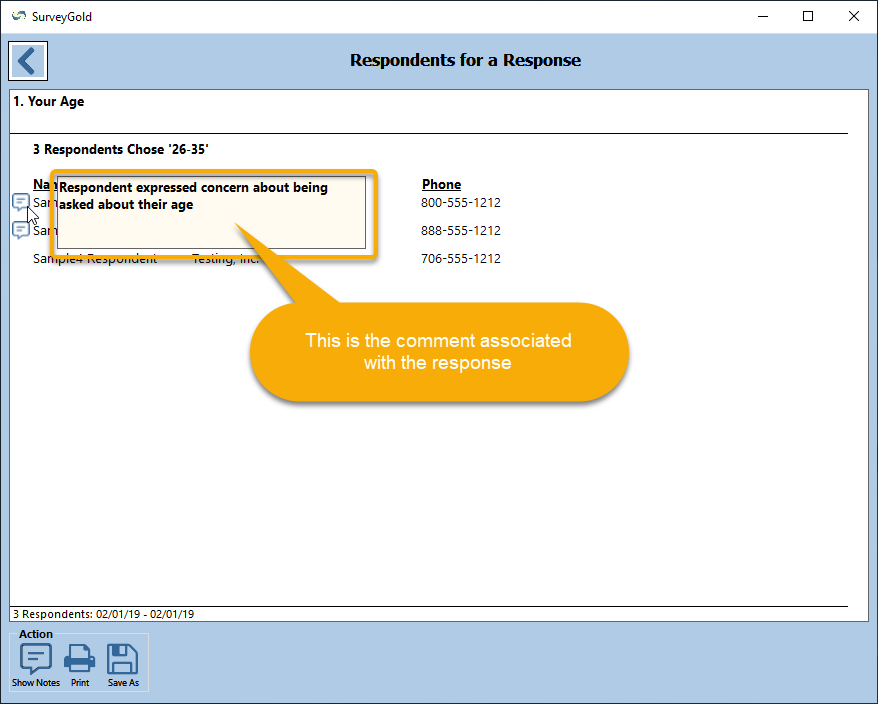
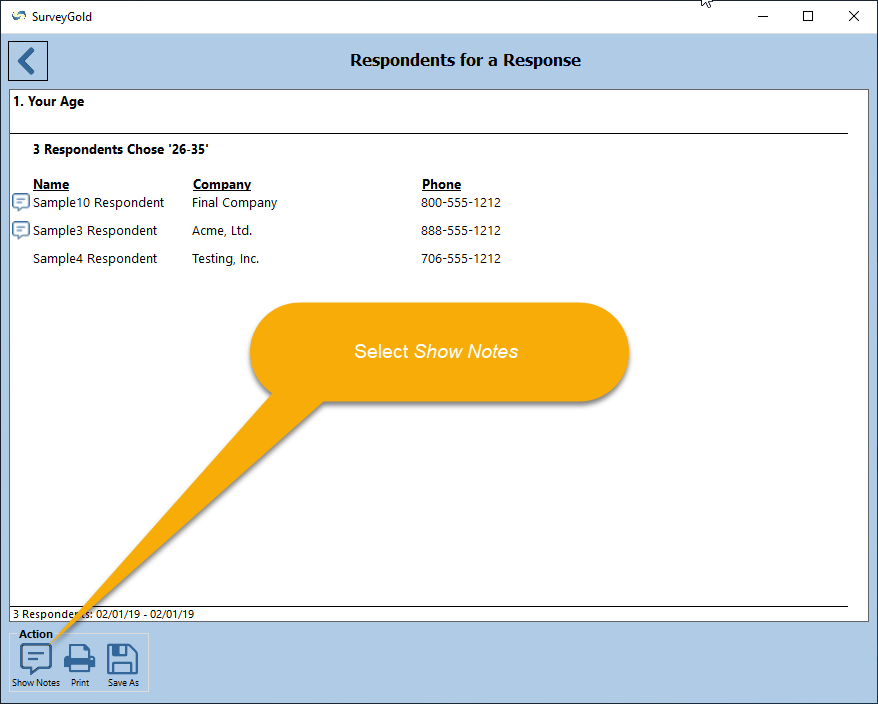
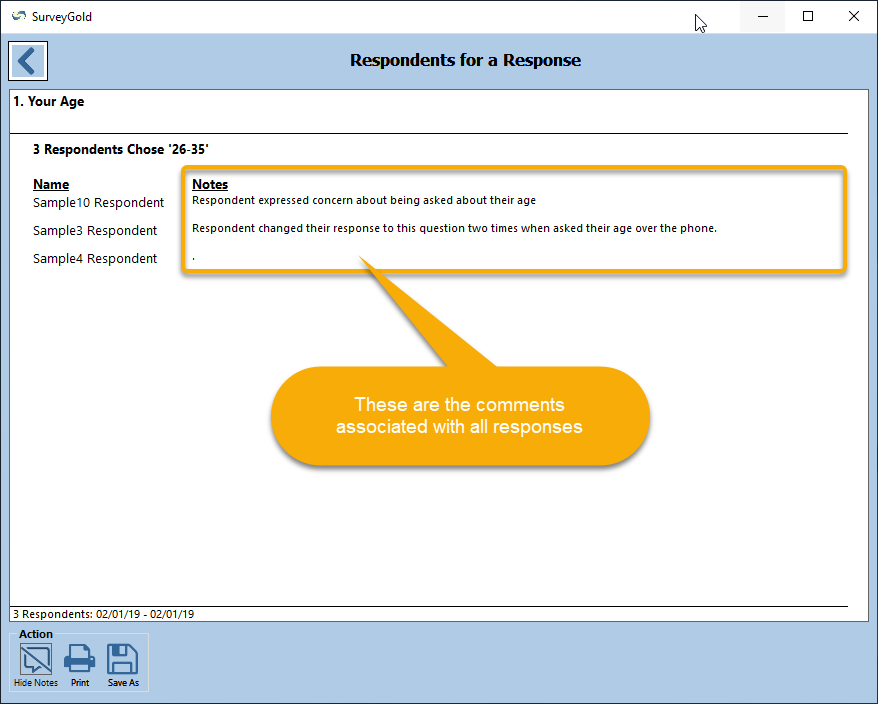
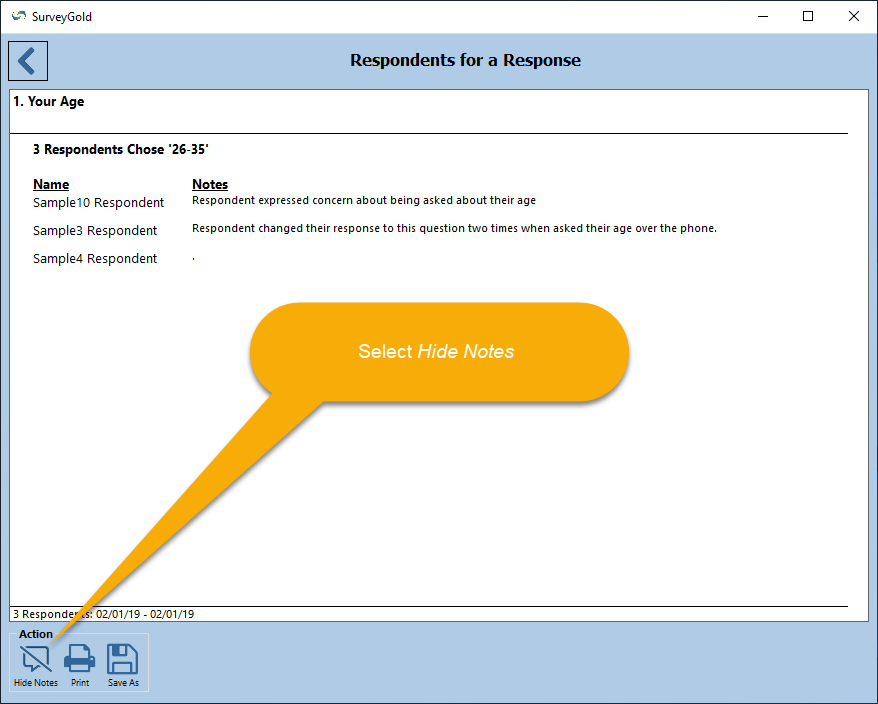
When a response has a note or comment associated with it, a caption bubble icon appears alongside the respondent name.
When a response has a note or comment associated with it, a caption bubble icon appears alongside the respondent name.
Drilling Down to View a Respondent's Completed Questionnaire
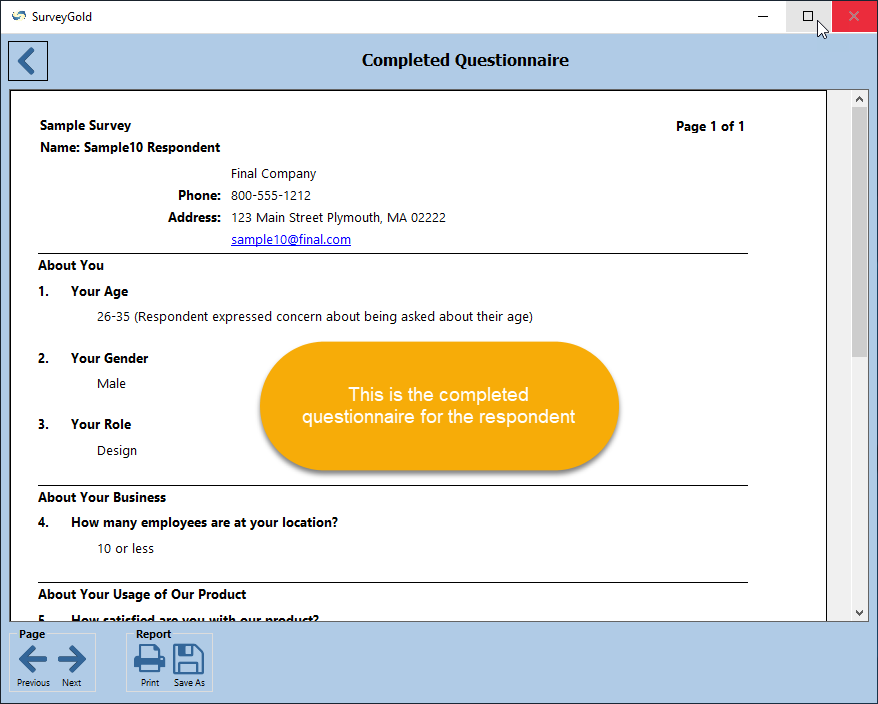
The respondent's completed questionnaire is the lowest level of detail and is accessible by selecting a respondent in the list of respondents.
The respondent's completed questionnaire is the lowest level of detail and is accessible by selecting a respondent in the list of respondents.
Manipulating Results Data
The results viewer provides powerful data manipulation capabilities by right-clicking on the response summary item (e.g., pie slice, bar, line, tabular list item) of any question. To view the responses for a subset of respondents (e.g., females of a certain age group who work for a certain sized company) simple right-click on those responses while viewing the results. This causes all other question responses to be viewed through the filtered set of respondents.
The results viewer provides powerful data manipulation capabilities by right-clicking on the response summary item (e.g., pie slice, bar, line, tabular list item) of any question. To view the responses for a subset of respondents (e.g., females of a certain age group who work for a certain sized company) simple right-click on those responses while viewing the results. This causes all other question responses to be viewed through the filtered set of respondents.
Viewing a Subset of Respondents Using a Filter
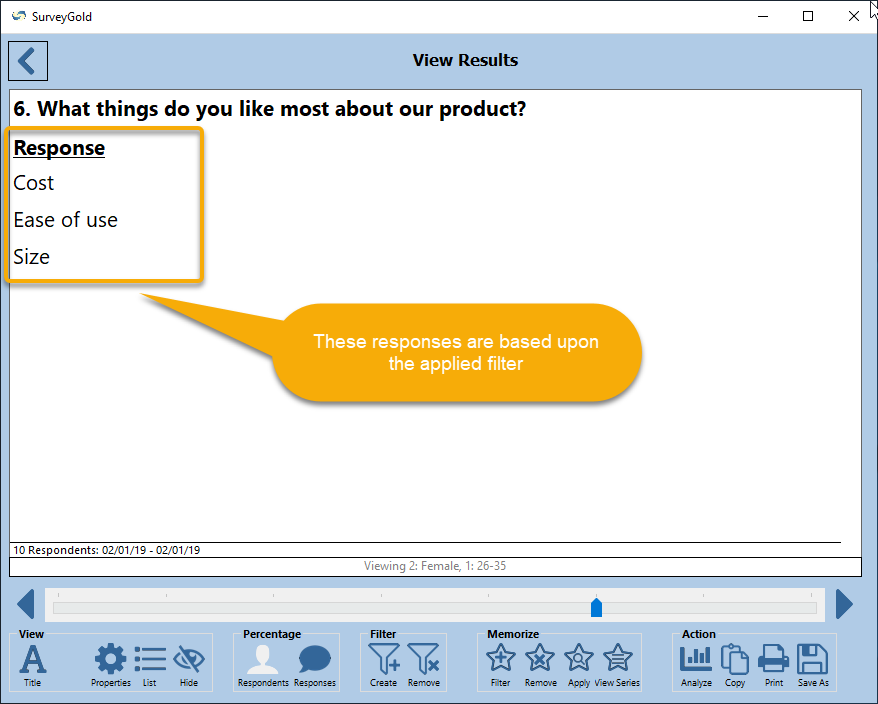
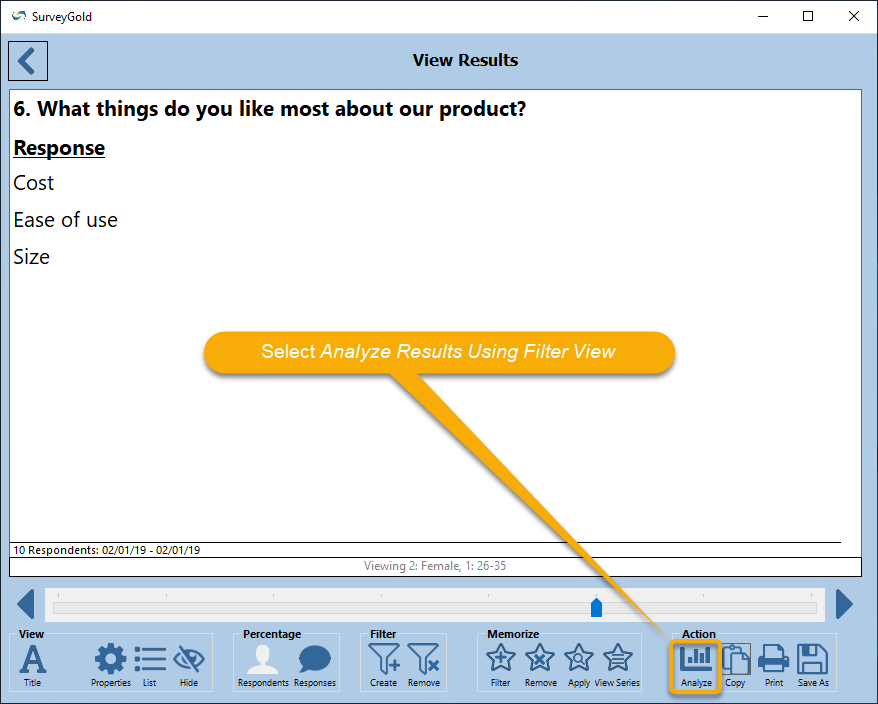
SurveyGold provides the ability to quickly and easily view results using a subset of respondents. This subset of respondents displayed in the view is based upon a defined filter. The filter can be defined as particular responses to particular questions, a response date range or a combination thereof. Once a filter is defined, the results viewed by navigating to different questions or performing actions in the Analyze Results tab are based upon the defined filter.
By way of example, we will use the Sample survey to view responses provided by females whose age is 26-35. While this example only includes two filter criteria (age and gender), there is no limit to the number of filter criteria that you can apply. You can filter on any response to any question. This provides the framework for very powerful survey response analysis.
|
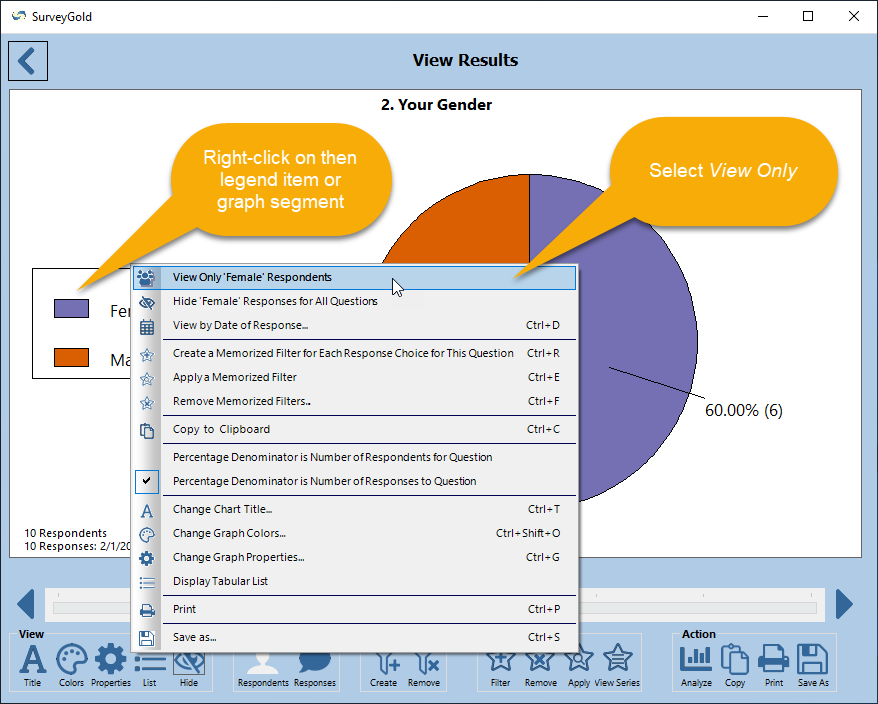
Step 1 - While viewing results of the Gender question, right-click on the "Female" response item or legend item and select "View Only 'Female' Survey Results" from the popup menu.
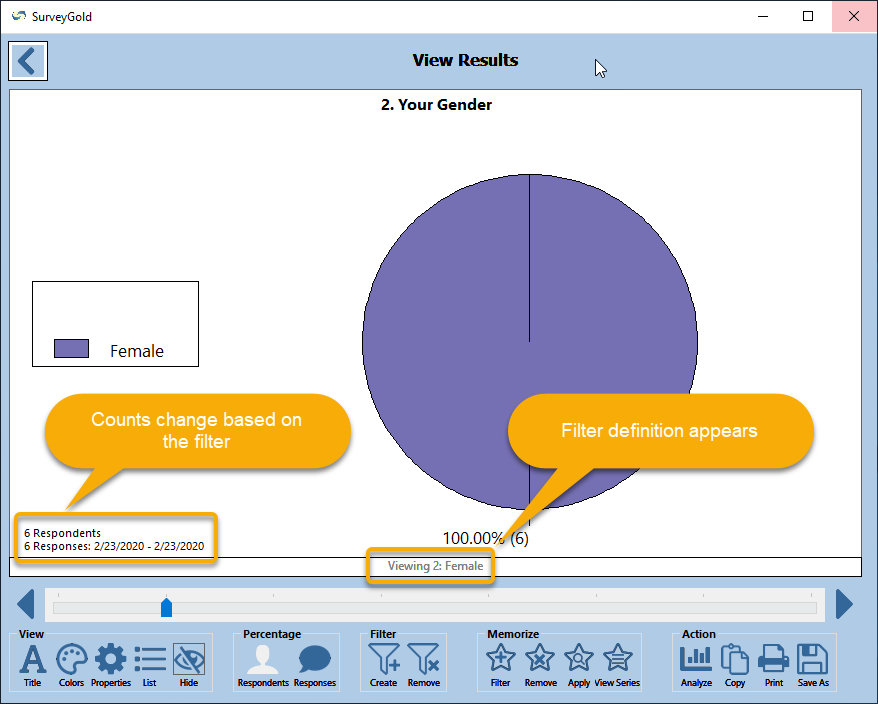
Note: You can optionally exclude respondents based on responses by holding down the Shift key before right-clicking on a pie slice. Note: You can optionally filter responses based on the date of response by right-clicking anywhere selecting "View By Date of Response" from the popup menu. The result of this action is a filtered view. The Gender question responses displayed are limited to only the female respondents. Note: After the filter is applied, the number of responses (shown in the lower left corner) is reduced from 10 to 6. Also the small text at the bottom shows the filter that is currently applied: The convention is the question number (abbreviated as 2, the second question) followed by the response to that question. |
|
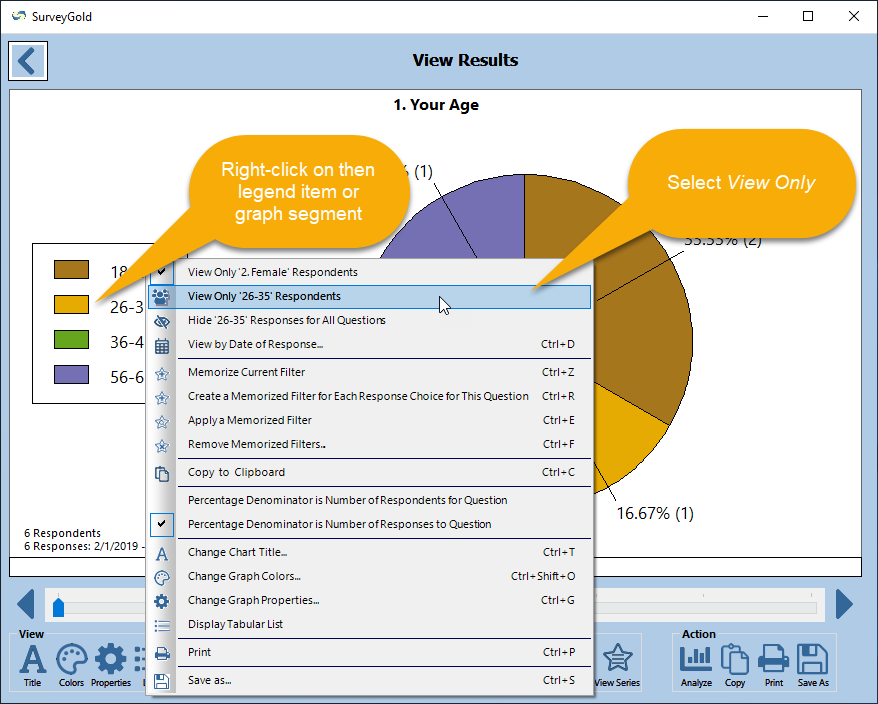
Step 2 - Navigate to the Age question. Then right-click on the "26-35" response item or legend item and select "View Only '26-35' Survey Results" from the popup menu.
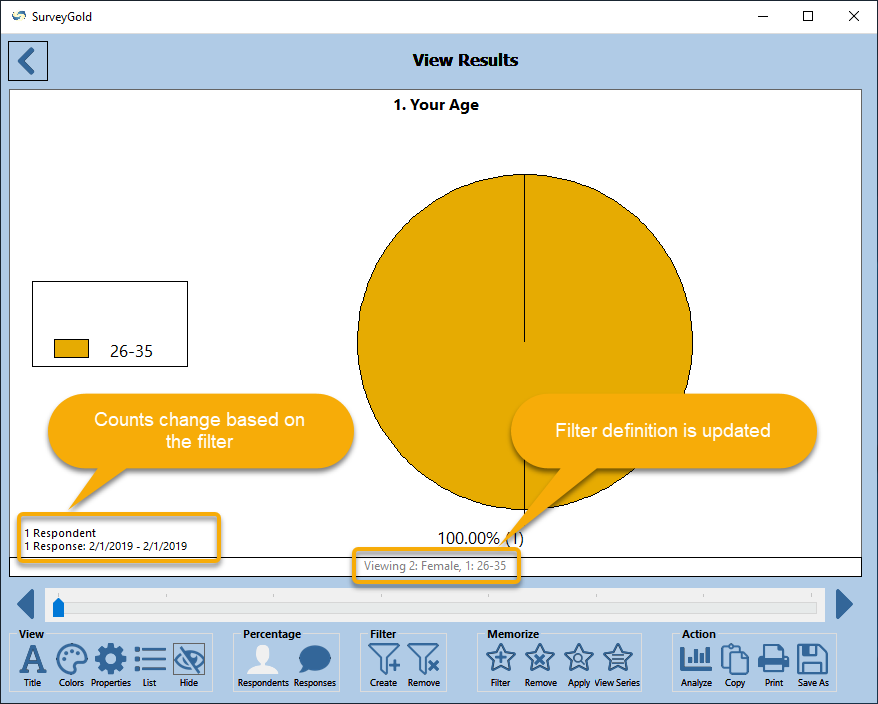
The result of this action is a more refined filtered view. The Age question responses displayed are limited to female respondents whose age is 26-35. Note: After the filter is applied, the number of responses (shown in the lower left corner) is reduced from 6 to 1. Also the small text at the bottom shows the filter that is currently applied. |
Memorizing a Filter
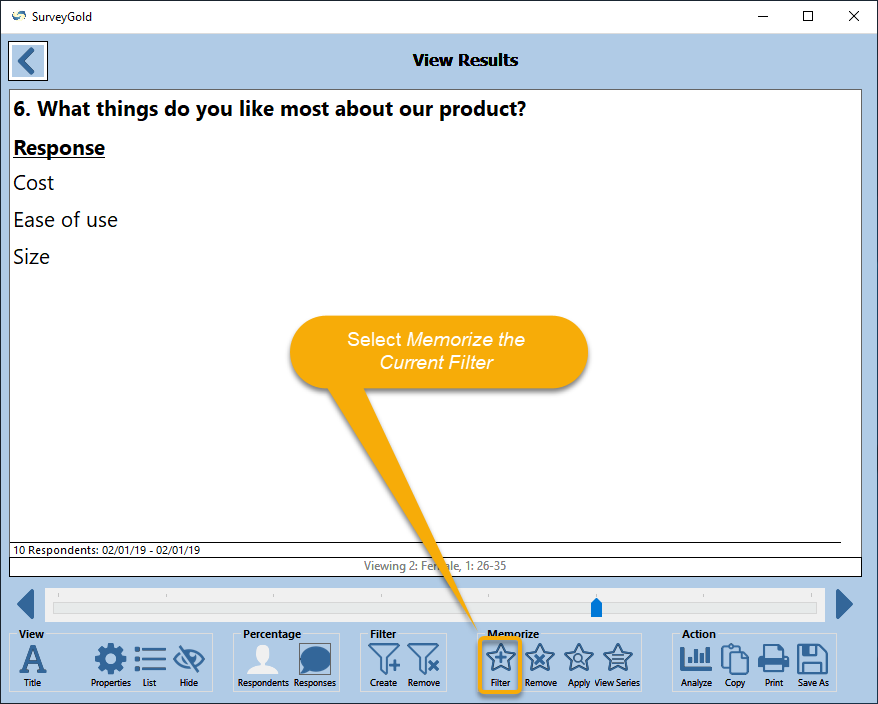
While you are viewing a filtered set of survey results, you can have SurveyGold memorize the filter for later use. The value to this feature is that provides quick and easy access to filters that you routinely apply when viewing you survey results. It also sets the stage for viewing results in multiple series, which will be covered in few topics from now.
In this example we will memorize the filter for female respondents with an age of 26-35 years old.
|
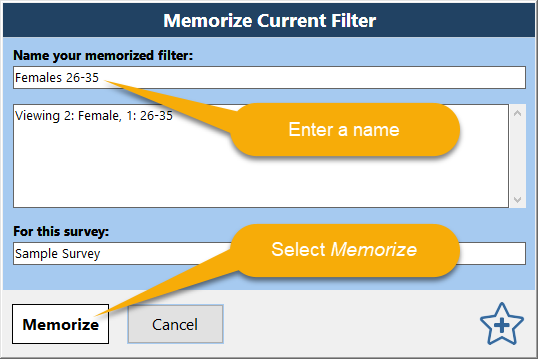
Step 2 - When the Memorize Current Filter window appears, enter a name for the filter and select Memorize.
Each memorized filter name must be unique within a survey. SurveyGold automatically creates a filter name for you that is based on the current filter. You can either accept the name the SurveyGold creates, or you can change it to a name that is more to your liking so long as it is a unique name within the survey. In our example, we name the filter "Females 26-35". |
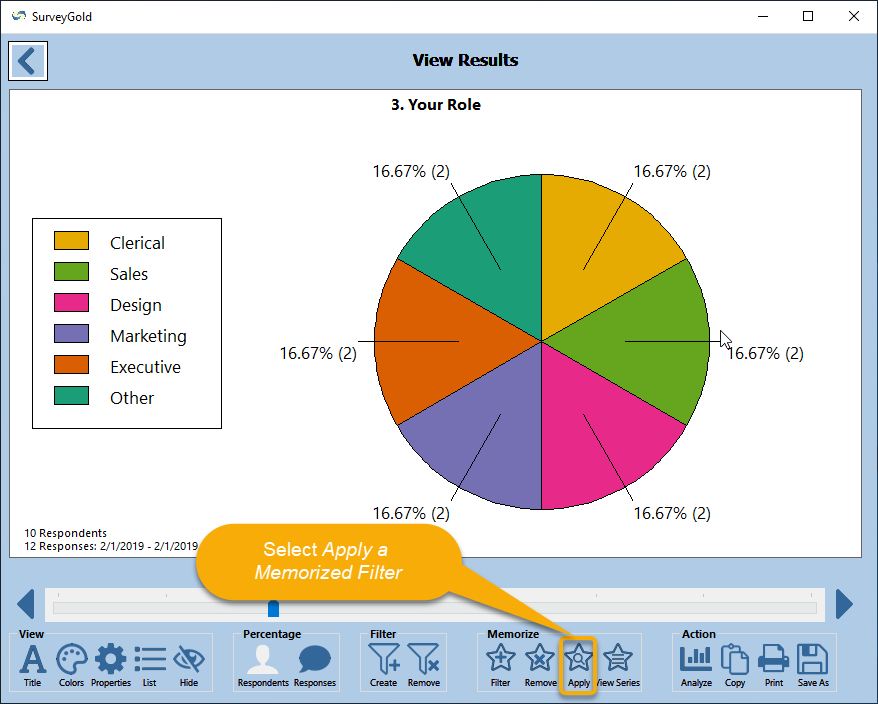
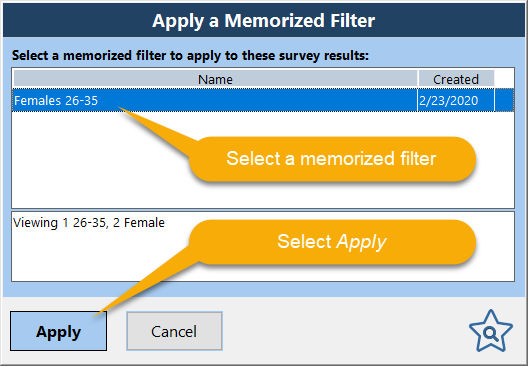
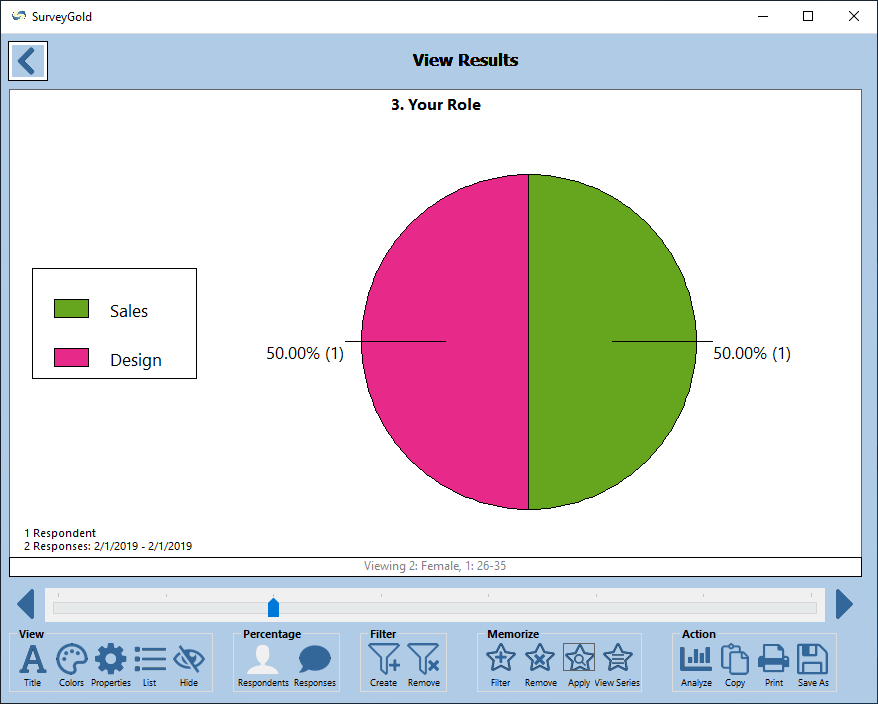
Applying a Memorized Filter
You can apply a memorized filter when viewing your survey results at any time that a filter is not currently applied. The value to this feature is that provides quick and easy access to filters that you routinely apply when viewing you survey results.
You can apply a memorized filter when viewing your survey results at any time that a filter is not currently applied. The value to this feature is that provides quick and easy access to filters that you routinely apply when viewing you survey results.
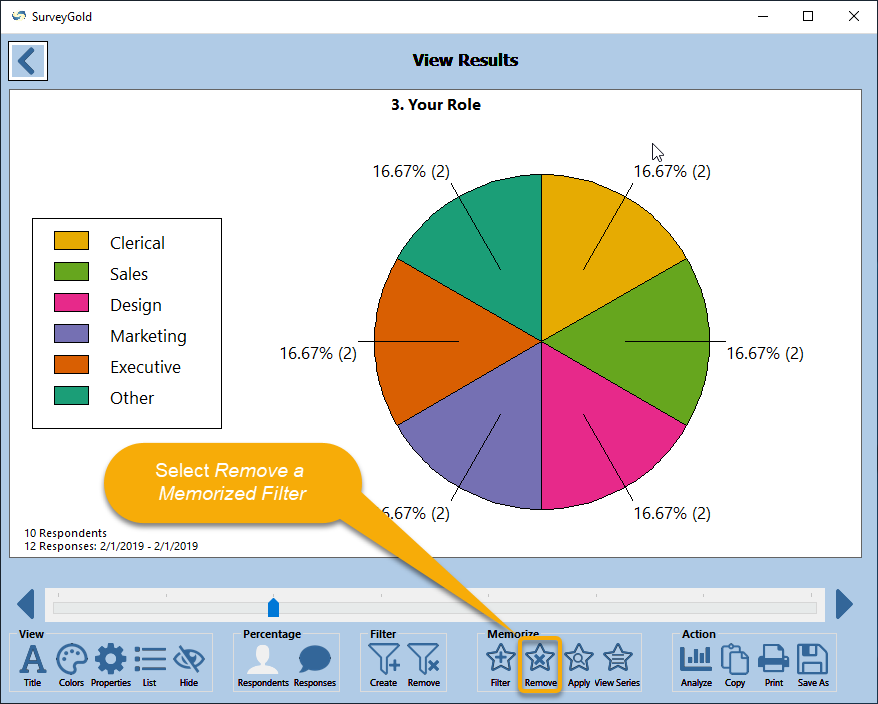
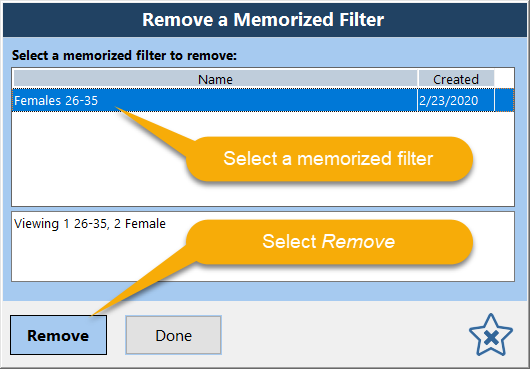
Removing a Memorized Filter
SurveyGold provides the ability to remove a memorized filter.
SurveyGold provides the ability to remove a memorized filter.
Comparing Different Sets of Respondents
This powerful feature leverages the memorized filter feature of View Results by providing the ability to display multiple sets of responses (side-by-side in multiple graph series) for the survey results you are viewing. The value of this feature is that it provides the ability to show trends of previous period to current period, comparisons of demographic groups, etc.
This feature supports the following business scenarios:
The results of these types of surveys are often measured against another “baseline” set of results. The baseline is typically a subset of responses to the survey that are used as a basis for comparison of current results. The subset of responses may be from a prior period (e.g., prior quarter, year to date, last year, etc.) or may be from a segment of the respondent population based on a demographic trait (e.g., business unit or division, job grade, tenure, etc.) or a response to a particular question…or a combination of period, demographic or question response.
Examples of this type of survey include:
Note: You must have at least two memorized filters for your survey in order for this feature to be enabled while viewing your survey results. Also, it is possible to display any number of series, limited only by your imagination and your practical business need.
The following example shows how to create a comparison of female and male respondents. It assumes that you have already created two memorized filters, one for male respondents and one for female respondents.
This powerful feature leverages the memorized filter feature of View Results by providing the ability to display multiple sets of responses (side-by-side in multiple graph series) for the survey results you are viewing. The value of this feature is that it provides the ability to show trends of previous period to current period, comparisons of demographic groups, etc.
This feature supports the following business scenarios:
- A survey is conducted periodically on an ongoing basis
- A survey is conducted whereby one or more subsets of survey respondents need to be compared
The results of these types of surveys are often measured against another “baseline” set of results. The baseline is typically a subset of responses to the survey that are used as a basis for comparison of current results. The subset of responses may be from a prior period (e.g., prior quarter, year to date, last year, etc.) or may be from a segment of the respondent population based on a demographic trait (e.g., business unit or division, job grade, tenure, etc.) or a response to a particular question…or a combination of period, demographic or question response.
Examples of this type of survey include:
- Continuous improvement surveys such as Total Quality Management (TQM) or Six Sigma
- Customer satisfaction or quality of service surveys
- Mandated compliance surveys (e.g., “No Child Left Behind” educational compliance)
- Program funding justification surveys that show before/after results
Note: You must have at least two memorized filters for your survey in order for this feature to be enabled while viewing your survey results. Also, it is possible to display any number of series, limited only by your imagination and your practical business need.
The following example shows how to create a comparison of female and male respondents. It assumes that you have already created two memorized filters, one for male respondents and one for female respondents.
|
Step 1 - While viewing any question of your survey results and when a filter is not applied, select View Series using Memorized Filter in the button bar.
|
|
Step 2 - When the Create Series using Memorized Filter window appears, select two or more memorized filters to display and select OK.
In our example, we will apply the memorized filters "Female" and "Male". |
|
Step 3 - The result of this action is that the previously displayed graph now has a legend item for each series and a list box for each series item appears above the graph.
Select a list box item for the desired series, such as "Female". The resulting graph displays the filtered view. Navigate to another question to see the responses based on the series. Select Analyze Results using Series View to perform actions in the Analyze Results tab using the filtered set of respondents in series. |
Applying a Numeric Value to a Response
When viewing a graph, when the mouse moves over a particular graph segment the enumeration value of that response is displayed . The enumeration value is the position of a response in the set of choices for a particular question. This value is used to determine the mean, mode, median and standard deviation for the responses.
To understand the concept of enumeration, consider the following question:
Please select your favorite flavor of ice cream.
( ) Chocolate
( ) Vanilla
( ) Strawberry
In this question, the choice "Chocolate" has an enumeration value of 1, because it is the first choice in the set. "Vanilla" has an enumeration value of 2, because it is the second choice in the set. "Strawberry" has an enumeration value of 3 because it is the third choice in the set.
Displaying Statistical Calculations
When viewing a graph for a non-ranking question, statistical calculations based on the enumeration values can be displayed in the lower right-hand side of the graph by right-clicking a selecting Display Mean, Mode, Median and Standard Deviation from the popup menu.
This calculations are the mean, mode, median, minimum, maximum and standard deviation based on the enumeration value for the question responses in the current view. If you prefer to not see these statistical calculations, simply right-click and unselect Display Mean, Mode, Median and Standard Deviation from the popup menu.
Saving Viewed Results to Other Data Formats
You may save anything displayed in the results viewer to a file. The file formats supported are many and include:
Note: This feature saves only the displayed responses to a file. If you want to save the entire set of survey responses for all questions to a file, that feature is enabled from the Analyze Results tab using the action "Convert Responses".
You may save anything displayed in the results viewer to a file. The file formats supported are many and include:
- Excel
- Text
- XML
Note: This feature saves only the displayed responses to a file. If you want to save the entire set of survey responses for all questions to a file, that feature is enabled from the Analyze Results tab using the action "Convert Responses".
|
Step 1 - When a graph or list is displayed in the viewer, select Save As from the button bar.
|
|
Step 2 - When the Save As window appears, locate the Save as type field and select a file type.
|
|
Step 3 - Enter a name for the file you want to create in the File name field and select Save.
|
Note: Here are a few of the many file types supported and along with their possible uses:
File Type Format Usage CSV Comma-separated values Suitable for merging into word processors CSV with headers Comma-separated values Like CSV except that it contains column headings DIF Data Interchange Format Useful for importing into other software products Excel 12 Excel XLSX Suitable for Microsoft Excel™-compatible spreadsheets Excel 12 with headers Excel XLSX Like Excel 12 except that it contains column headings HTML Hypertext Markup Language Suitable for viewing with a web browser Text Tab-separated values Suitable for merging into word processors Text with headers Tab-separated values Like Text except that it contains column headings Windows Metafile Graphical image Suitable for including in a web page, word processing document, or other publishing software. Also suitable for use with image editing software. XML Extensible Markup Language Suitable for including in a web page, word processing document, or other publishing software. XSL-FO Extensible Stylesheet Language Formatting Objects An XML-based markup language describing the formatting of XML data for output to screen, paper or other media.

