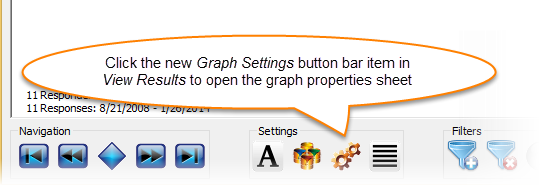
Button Bars in View Results and Analyze Results
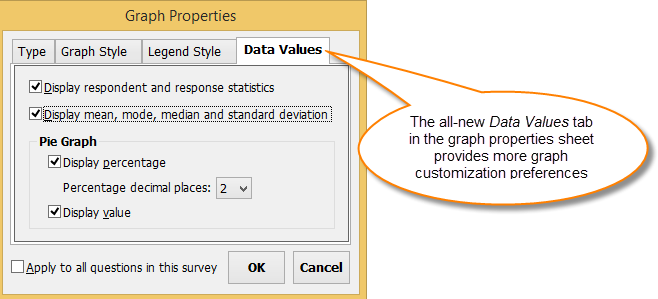
Enhanced Graph Properties
- Hide or show percentages in a pie graph
- Set the decimal points displayed in percentages
- Hide or show values in a pie graph
- Hide or show respondent and response counts
- Hide or show mean, mode, median, min, max and standard deviation
How To Acquire the Update
- Select About in the SurveyGold application tool bar.
- Perform the Update SurveyGold action.


 RSS Feed

